Most failed test reports give you three things: a screenshot, a final URL, and a list of actions the agent tried. That covers the obvious failures. It does not cover the awkward ones, where the click registered but the DOM was already mid-render, or a network response came back malformed and the UI silently fell back to an empty state. For those cases you really want to step through the run frame by frame.
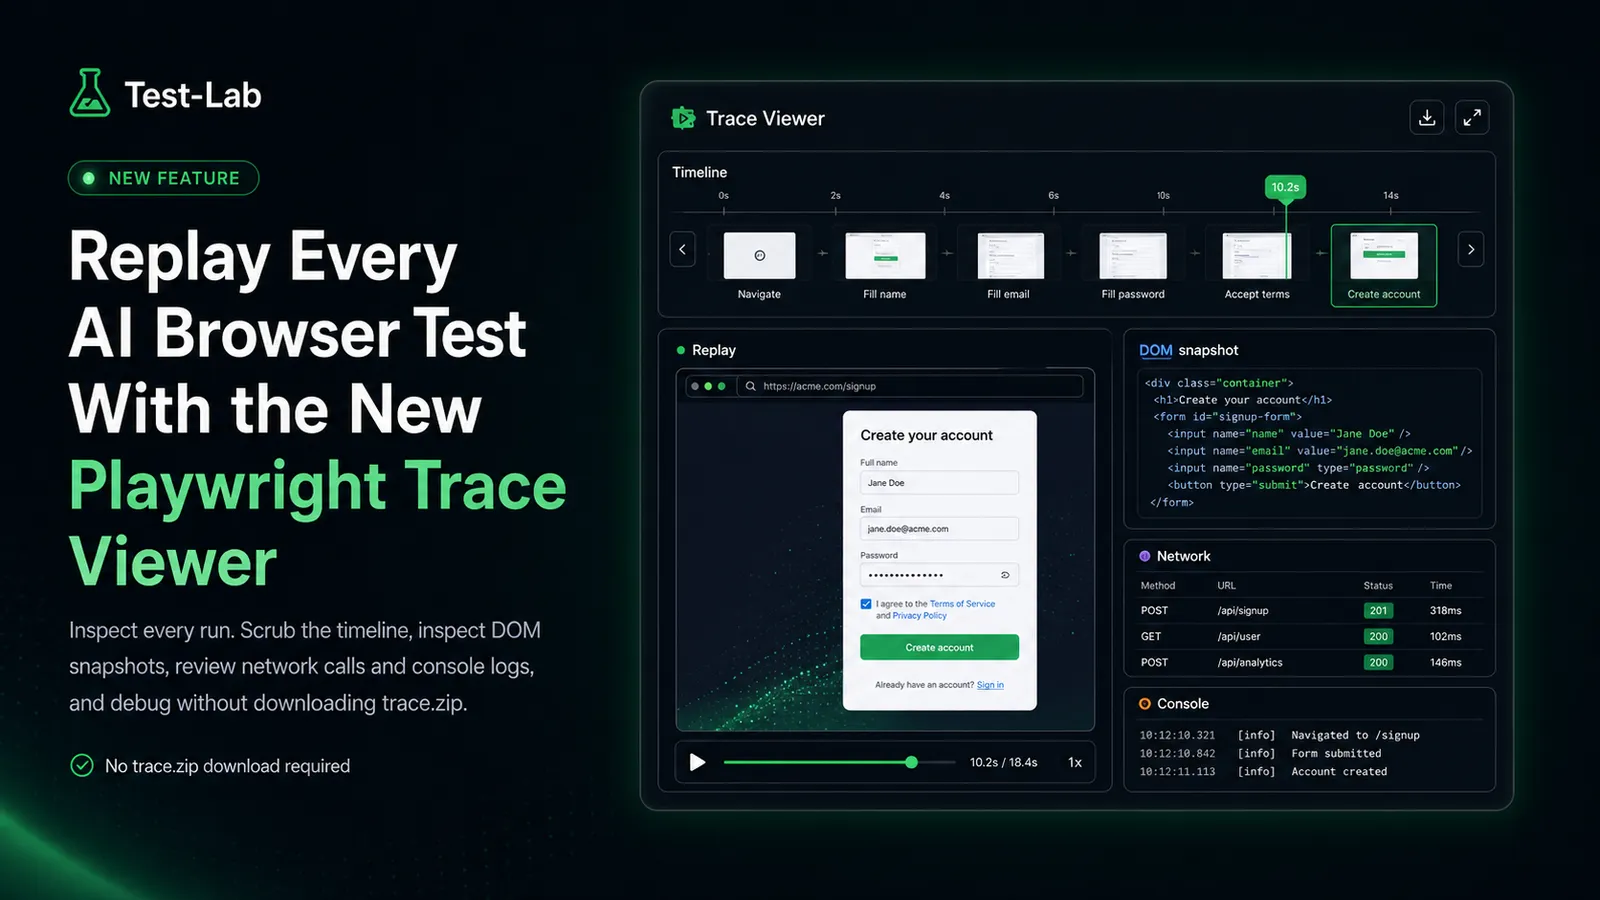
Playwright already has the perfect tool for this. The trace viewer, normally reached by downloading a trace.zip and running npx playwright show-trace, has been the gold standard for replay debugging in Playwright for years. Today we are removing the download step. Every AI browser test run on Test-Lab now produces a Playwright trace, and the trace viewer is embedded directly inside the run report.
What's in the trace
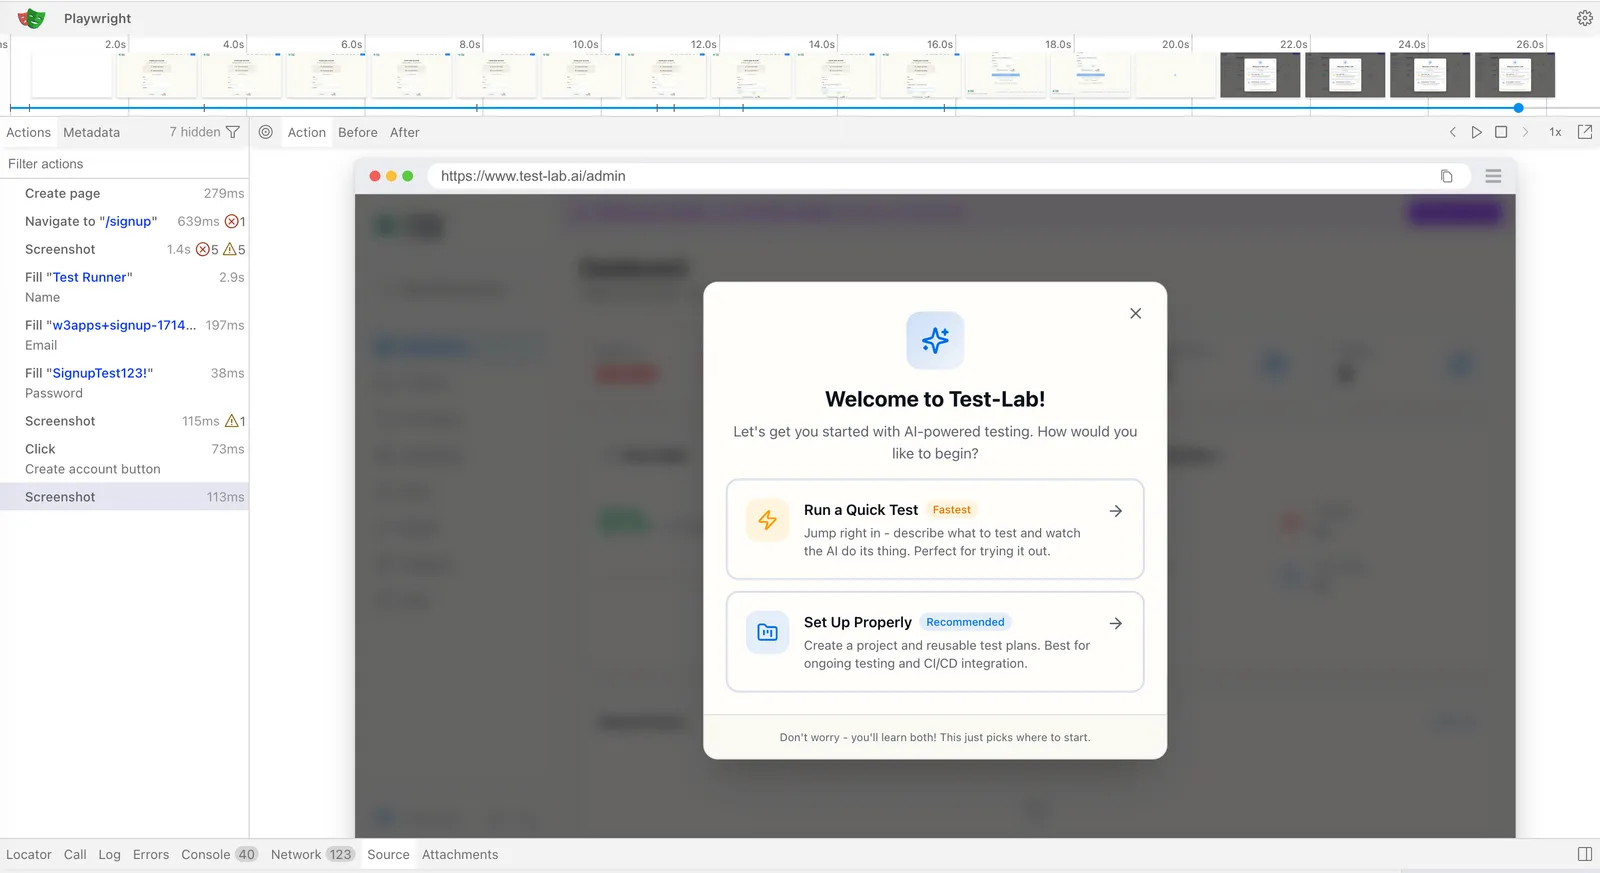
Click "View trace" on any step in a run report and a full Playwright trace viewer opens in a modal with everything you would expect:
- A scrubbable action timeline along the top, with thumbnails for each step
- DOM snapshots at every action, so you can inspect the live element tree at the moment of the click, fill, or assertion
- Network panel listing every request and response, including failures, redirects, and slow loads
- Console panel with logs, warnings, and errors emitted during the run
- Source view with the synthesized Playwright actions the AI agent produced
- A frame-by-frame replay of the page in the screenshot panel
Same surface area as playwright show-trace locally. No download, no terminal, no extra tooling.
How replay changes the debugging loop
The hardest debugging problems in AI browser testing are not the model picking the wrong button. They are the cases where the model picked the right button but the page state was wrong, and the only way to know is to look at the DOM at action time and see what the agent actually saw.
Before this, that meant collecting a screenshot, an action log, sometimes a console capture, and reasoning backwards. The loop is now much tighter. Open the failing run, hit "View trace" on the suspect step, scrub to the moment, inspect the DOM, check the network panel, see whether the API call you expected actually fired. Most of the awkward failure modes resolve in under a minute.
It also makes the AI's decisions auditable. If the agent clicks a "Continue" button that turned out to be the wrong one, the trace shows you both the DOM at decision time and the snapshot the agent reasoned over. You stop arguing with the model and start arguing with the page.
Per-step traces for healing and pipeline runs
Some test plans run multiple Playwright passes in a single run: a script generation, a heal attempt, a refined retry, or a multi-step pipeline that chains several flows. We capture an independent trace per pass. The run report exposes them as a row of "View trace" buttons, one per step, so you can compare what the page looked like on the failing run versus the recovery attempt.
This matters most for the self-healing flow. When a script breaks and the healer proposes a patch, you can pull up both traces side by side, see what changed in the DOM between the original recording and the failure, and decide whether the proposed patch fits the new behavior. Patches stop being trust-by-default.
Where the trace viewer fits in your debugging stack
If you already use Playwright traces locally, this is the same primitive, served closer to where the failure is reported. Three workflows get faster:
- CI failure triage. No more "download artifact, unzip, run viewer". The trace is one click from the failure notification.
- Reproducing customer-reported issues. Run a test plan against the affected flow, share the run report URL, and let the reviewer scrub through the trace without installing anything.
- Reviewing AI-generated scripts. When the agent generates a Playwright spec, you can replay the original run that produced it, then compare the spec to what actually happened on the page.
It also pairs with the debugging triage playbook we published earlier this year. The classification questions in that post (stale DOM, auth drift, bot wall, navigation surprise) are all questions a Playwright trace can answer in seconds rather than minutes.
Storage, security, and what counts against your plan
Trace replay is wired into every paid test run at no extra cost. The button shows up in the run report next to the screenshots and the action log, alongside any other run artifacts.
A few details worth knowing:
- Demo runs (the ones you can fire without an account) do not capture real traces. The modal renders a static preview plus a sign-up prompt so you can see the surface before you spend a cent. Real traces start the moment you sign up.
- Traces live in private object storage and are served through short-lived presigned URLs. The viewer SPA streams the bytes through a service worker, so nothing in the trace leaves the browser session that opened it.
- Traces are retained for the lifetime of the run report. Delete the run, the trace goes with it.
Try it
The fastest way to see the trace viewer in action is to run a test that intentionally fails. Pick a small flow on your app, change an expected button label to something that does not exist, and click run. When the report comes back, hit "View trace" and walk the timeline. The DOM snapshot at the failing step will tell you exactly which element the agent settled on and why your assertion did not match.
If you do not have an app handy, start a free trial and head to the test plan reports page. Every new account gets $3 of free credit, more than enough for a handful of runs and a real look at the trace UI.
There is more on the roadmap around the trace surface, including shareable trace links you can paste into a PR review, deeper acceptance-criteria highlighting in the timeline, and trace search across runs. The base experience is shipping today.